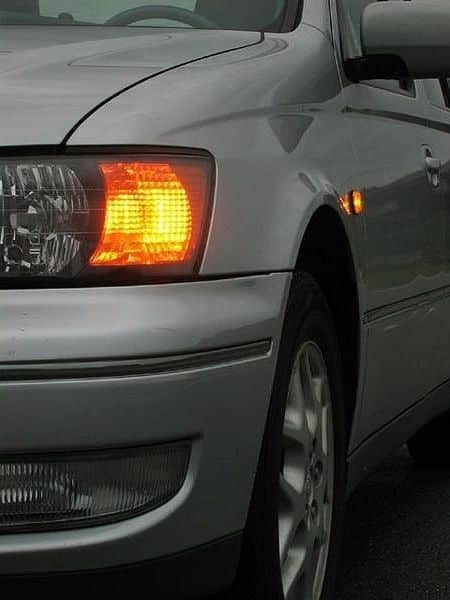
A left turn can take only a few seconds, but in those few seconds, there are several decisions and judgments that a driver needs to make, all while watching for pedestrians, cyclists, and motorcyclists.
For Connor Lopez, a 23-year-old motorcyclist, this few-second left turn by another driver proved fatal.
On April 23, 2025, Lopez was riding on Sheldon Road, a road located in Elk Grove, California, when an oncoming SUV turned left across his route, failing to yield; the collision ended his life. The SUV driver was later charged with misdemeanor vehicular manslaughter.
In the aftermath of her son’s death, Lopez’s mother, Allison Lyman, became an advocate for greater accountability in fatal driving cases. The tragedy also illustrates a larger issue with left turns themselves.
Sheldon Road is a wide, multi-lane arterial roadway, not an intersection that officials identified as failing to meet applicable design standards. Following Lopez’s death, Elk Grove reviewed the location and later added a yield sign. But the broader lesson is that even roads designed to meet modern standards still require drivers to make accurate decisions about gaps in traffic, vehicle speeds, and approaching road users before crossing opposing lanes.
National research cited by the National Highway Traffic Safety Administration (NHTSA) found that turning left is a leading pre-crash event in 22% of crashes, compared with just 1.2% involving right turns.
Right turns generally move with or away from the flow of opposing traffic and usually involve a single lane. On the other hand, a left turn often requires a driver to cross directly through oncoming lanes.
The danger extends beyond other vehicles. According to the Insurance Institute for Highway Safety (IIHS), left-turn crashes account for nearly one-third of pedestrian-involved crashes at intersections. Drivers making a left turn may be focused on finding a gap in oncoming traffic while pedestrians, cyclists, and motorcyclists enter their path.
Vehicle design can also impact how dangerous and challenging these turns can be. A 2025 IIHS study found that vehicles with large driver-side blind zones had a 70% higher risk of striking a pedestrian while turning left than vehicles with smaller blind zones.
One thing that can reduce some of these risks is road design. IIHS research on centerline hardening found that treatments designed to force slower, squarer left turns reduced conflicts between left-turning vehicles and pedestrians by about 70%.
The findings point to an important reality: left–turn safety depends on both driver decisions and the design of the roads where those decisions are made.
To better understand where fatal left-turn crash risks are most pronounced, Sweet James analyzed 2020 through 2024 Fatality Analysis Reporting System (FARS) data across all 50 states and Washington, D.C. The analysis focused on drivers involved in fatal crashes where turning left was identified as the pre-crash critical event.
Nationally, the cumulative population-adjusted rate of left-turning drivers involved in fatal crashes was approximately 6.10 per 100,000 residents age 15 and older.
By comparison, the rate for right-turning drivers was just 0.42 per 100,000.
That means left–turning drivers appeared in fatal crashes at a rate 14.37 times higher than right-turning drivers. Among the combined left- and right-turn categories, left turns accounted for 93.5% of driver involvements.
The Left Turn Fatal Crash Risk Index examines 11 factors:
- Overall driver demographics
- Motorcycle involvement
- Pedestrian involvement
- Cyclist involvement
- Large-truck involvement
- Distracted driving
- Driver impairment
- Hit-and-run involvement
- Vehicle type
- Time of day
- The prevalence of left turns compared with right turns.
Each category contributed equally, at 9.09% of the final score. State rates were normalized to a 0-to-100 scale and averaged, with higher scores indicating greater relative fatal-crash involvement risk.
The study measures fatal-crash involvement, not every left-turn collision or every person injured or killed in a left-turn crash. Categories can also overlap. In addition, the available time-of-day data covers only crashes occurring between 1 a.m. and 12:59 p.m., meaning the analysis cannot identify a full 24-hour daily peak.
Still, the results reveal clear patterns in where left-turn risk is highest, who is most often involved, and which road users face the greatest danger.
States with the Highest Left-Turn Fatal Crash Risks
The Left Turn Fatal Crash Risk Index found a strong concentration of risk in the South and Southwest, with Arizona ranking as the nation’s highest-risk state overall.
A high direct rate of left-turning drivers involved in fatal crashes is the clearest pattern connecting the top states.
Eight of the 10 highest-risk states also rank among the nation’s top 10 for their direct left-turn fatal-crash rate per 100,000 residents age 15 and older: Florida, Arizona, South Carolina, Delaware, Mississippi, Kentucky, New Mexico, and Tennessee.
But the index is not simply a ranking of states with the highest direct left-turn rates. Florida, for example, has the highest direct left-turn rate in the country at 12.93 per 100,000 residents age 15 and older.
Arizona’s rate is slightly lower at 12.47. Arizona still ranks No. 1 overall because its elevated risk extends across more categories in the index, including the nation’s highest rates for motorcycle involvement and driver impairment.
“Left turns create a uniquely demanding driving situation because drivers must judge oncoming traffic while also accounting for pedestrians, cyclists, and motorcycles,” said a representative from Sweet James. “The data shows why this maneuver should be treated as more than a routine part of driving.”
The highest-risk states also share several other characteristics.
Motorcycle Involvement Is a Major Pattern
Seven of the top 10 overall states also rank among the 10 highest nationally for motorcycle-involved fatal crashes involving left-turning drivers. Arizona leads the country at 6.09 per 100,000 residents age 15 and older, followed by:
- Florida: 5.94
- South Carolina: 5.34
- Nevada: 5.01
- Delaware: 4.60
Motorcycle involvement is particularly significant because riders are more exposed and less protected than occupants of passenger vehicles. A driver who misjudges the speed or distance of an approaching motorcycle may leave the rider with little time or space to avoid a collision.
Distraction Also Concentrates in High-Risk States
The four highest population-adjusted rates of distracted left-turn driving all occurred in states that ranked in the overall top 10.
Louisiana led the country at 3.09 per 100,000, followed closely by Kentucky at 3.06. New Mexico and Florida also ranked among the highest.
This suggests that left-turn danger cannot always be explained by one roadway feature or one demographic group. States near the top of the index often show elevated risk across multiple categories.
Hit-and-Run and Impairment Add Another Layer of Risk
Six of the 10 highest-risk states also rank in the national top 10 for hit-and-run involvement:
- Arizona
- Nevada
- Florida
- Tennessee
- Delaware
- Kentucky
Five also rank among the top 10 for impaired left-turn driving:
- Arizona
- Nevada
- Delaware
- South Carolina
- Florida
Older drivers are another pattern shared across the entire top 10. In every one of the highest-risk states, drivers age 75 and older had the highest age-specific population-adjusted left-turn fatal-crash rate.
Call or text (800) 900-0000 or complete a Free Case Evaluation form
The 10 States With the Lowest Left-Turn Fatal Crash Risks
In the table below, Rank 1 (Idaho) is the highest-scoring state within this lowest-risk group, while Hawaii, at Rank 10, had the lowest risk score of any state in the index.
The low-risk pattern is even stronger when looking at direct left-turn fatal-crash rates.
Nine of the 10 lowest-risk states also rank among the bottom 10 nationally for their direct left-turn rate. Hawaii, Rhode Island, Vermont, Massachusetts, Idaho, New York, Minnesota, Virginia, and North Dakota all fall into both groups. Alaska is the only exception.
The lowest-risk states also generally avoid elevated rates across multiple categories at once. All 10 fall within the bottom 20 nationally for both motorcycle and large-truck involvement.
There is also a clear geographic difference between the two groups. Nine of the 10 highest-risk states are located in the Census-defined South or Southwest. Nevada is the only exception. The lowest-risk states, by comparison, are spread more widely across the country.
The results show why a composite index can provide a broader picture than one statistic alone. A state may have a high direct left-turn crash rate, but its overall risk rises further when motorcycle involvement, distraction, impairment, hit-and-run crashes, and other factors are also elevated.
Call or text (800) 900-0000 or complete a Free Case Evaluation form
Riskiest Demographics of Left-Turn Crashes
The national data reveals a clear overall demographic profile for drivers involved in fatal left-turn crashes. Men had a substantially higher population-adjusted involvement rate than women: 7.55 per 100,000 male residents age 15 and older, compared with 4.54 for women. That makes the male rate approximately 66% higher.
Drivers Age 75 and Older Have the Highest Overall Risk
Drivers age 75 and older had by far the highest national left–turn fatal–crash involvement rate at 12.77 per 100,000.
That was more than double the rate among drivers ages 65 to 74, who recorded a rate of 6.33, and drivers ages 21 to 24, who had a rate of 6.04. The pattern was remarkably consistent across the country.
Drivers aged 75 and older were the highest-rate age group in 46 of the 51 jurisdictions studied. South Carolina had the highest rate for this age group at 25.68 per 100,000, followed by Kentucky at 24.98 and Florida at 22.19. Only Alaska, Washington, D.C., Hawaii, Rhode Island, and Vermont had another age group with the highest rate.
The findings do not mean that every older driver is unsafe. Instead, they highlight the increased demands of left turns, which require drivers to process multiple sources of information at once, including traffic speed, distance, gaps, pedestrians, and other potential hazards.
Late Morning and Noon Were the Peak in the Available Data
It’s important to note that the study’s time-of-day dataset only covers crashes occurring between 1 a.m. and 12:59 p.m., so it cannot identify the most dangerous hour across an entire 24-hour day. Within that available window, however, left-turn fatal-crash involvement climbed through the late morning. The rate increased from:
- 0.24 per 100,000 at 10 to 10:59 a.m.
- 0.29 at 11 to 11:59 a.m.
- 0.35 at noon to 12:59 p.m.
Noon to 12:59 p.m. was the highest period in the available data. Because afternoon and evening hours were not included in the supplied dataset, these figures should not be interpreted as showing that noon is the overall most dangerous time of day.
Passenger Cars Had the Highest Vehicle-Type Rate
Passenger cars accounted for the highest population-adjusted vehicle-type involvement rate at 2.50 per 100,000 residents age 15 and older. They were followed by:
Some important context to keep in mind when looking at the data is that passenger cars are some of the most common across United States roads.
The index measures population-adjusted involvement rates rather than determining that one vehicle type is inherently more dangerous in every left-turn situation.
Distraction Follows a Different Age Pattern
Distracted left-turn driving occurred nationally at a rate of 0.39 per 100,000 residents age 15 and older. Men had a higher rate than women, at 0.44 compared with 0.33. By age, however, drivers 75 and older again stood out. Their distracted-driving rate was 0.89 per 100,000, more than twice the 0.41 rate among drivers ages 65 to 74.
Louisiana recorded the highest state rate for distracted left-turn driving at 3.09, followed by Kentucky at 3.06 and New Mexico at 2.24.
Impaired Driving Skews Younger
Impaired left-turn driving produced one of the largest gender differences in the study. Nationally, the rate was 0.32 per 100,000. Men had a rate of 0.46, compared with just 0.18 among women, making the male rate approximately 2.6 times higher. Unlike overall left-turn risk, impairment was most concentrated among younger and middle-aged drivers.
Drivers ages 25 to 34 had the highest rate at 0.43 per 100,000, followed by drivers ages 35 to 44 at 0.41. Arizona had the highest state impairment rate at 1.02, followed by Nevada at 0.84 and Montana at 0.76.
Hit-and-Run Risk Peaks Among Drivers Ages 21 to 24
Hit-and-run involvement occurred nationally at a rate of 0.14 per 100,000. The gender gap was particularly large among drivers whose sex was recorded. Men had a rate of 0.16, compared with 0.04 for women. Drivers aged 21 to 24 had the highest age-specific rate at 0.15. Drivers aged 35 to 44 and 25 to 34 both followed at approximately 0.14.
Washington, D.C., had the highest rate of any jurisdiction at 0.53. Among states, Arizona ranked highest at 0.41, followed by Nevada at 0.34.
A Note About the Behavioral Risk Patterns
The data does not describe one single driver profile in which all of these risks occur together. Instead, different behaviors follow different demographic patterns.
National risk patterns vary by behavior. Overall, left-turn fatal-crash involvement is highest among drivers aged 75 and older.
Distraction is also highest among drivers 75 and older, while impairment peaks among drivers ages 25 to 34, and hit-and-run involvement peaks among drivers ages 21 to 24.
These are separate patterns and should not be interpreted as characteristics occurring together in the same crashes.
Taken together, the overall highest-risk profile in the population-adjusted data is a male driver age 75 or older operating a passenger car, with involvement peaking around noon within the limited 1 a.m. to 12:59 p.m. dataset. But the behavioral data shows that left-turn risk is more complicated than any single demographic profile.
Call or text (800) 900-0000 or complete a Free Case Evaluation form
Road-User Dangers: Who Is Most at Risk?
Left turns do not create the same level of risk for every type of road user. The largest disparity in the study appeared when comparing motorcycle, pedestrian, and cyclist involvement.
Motorcycle involvement occurred at approximately 27 times the pedestrian rate and roughly 90 times the cyclist rate.
Motorcycles Face the Highest Left-Turn Risk
Motorcycles were by far the most prominent vulnerable road-user category in the index. Arizona had the highest motorcycle-involvement rate at 6.09 per 100,000 residents age 15 and older. Florida followed at 5.94, followed by South Carolina at 5.34, Nevada at 5.01, and Delaware at 4.60.
The demographics in this section refer specifically to the left–turning drivers involved in the fatal crashes, not the motorcyclists themselves.
Among those drivers, men had a rate of 3.41 per 100,000 compared with 2.01 among women, making the male rate about 70% higher. Drivers ages 21 to 24 had the highest motorcycle-involvement rate at 3.10, followed by drivers aged 75 and older at 2.94 and drivers ages 25 to 34 at 2.91.
This is notably different from the overall left-turn profile, where drivers age 75 and older dominate. Motorcycle-related left-turn crashes show a greater concentration among younger drivers.
Pedestrians Face a Different Set of Risks
Pedestrian-involved fatal left-turn crashes occurred nationally at a rate of 0.10 per 100,000. Utah stood out as a major outlier, recording a rate of 0.57, more than five times the national rate. Other high-ranking jurisdictions included:
- Washington, D.C.: 0.35
- Arizona: 0.26
- Florida: 0.25
- Missouri: 0.22
Going into the demographics of the drivers who collide with pedestrians, male left-turning drivers had a higher pedestrian-involvement rate at 0.12, compared with 0.07 among women. Drivers ages 21 to 24 had the highest age-specific pedestrian-involvement rate at 0.12, narrowly ahead of drivers ages 35 to 44 at 0.11.
With left turns, pedestrian safety is also at higher risk because of all the other things a driver making this turn has to pay attention to.
Call or text (800) 900-0000 or complete a Free Case Evaluation form
Cyclist-Involving Crashes Were the Least Common but Still Significant
Cyclist-involving fatal left-turn crashes had the lowest population-adjusted rate of the three categories at 0.03 per 100,000. Delaware had the highest state rate at 0.24, followed by Washington, D.C. at 0.18, Arizona at 0.16, Florida at 0.10, and New Hampshire at 0.08.
The gender gap was the largest of the three vulnerable-road-user categories. Male drivers had a rate of 0.04 per 100,000, compared with 0.02 for women, making the male rate approximately 2.6 times higher.
Drivers ages 25 to 34 had the highest age-specific cyclist-involvement rate at 0.05, followed closely by drivers aged 75 and older at 0.04.
Arizona and Florida Stand Out Across Multiple Road-User Categories
Arizona was the strongest across–the–board road–user risk state in the index. It ranked:
- No. 1 for motorcycle involvement
- No. 3 for pedestrian involvement
- No. 3 for cyclist involvement
Florida showed a similar pattern, ranking No. 2 for motorcycle involvement and No. 4 for both pedestrian and cyclist involvement.
The broader demographic pattern also shifts depending on who is involved in the crash. While drivers age 75 and older have the highest overall left-turn fatal-crash involvement rate, vulnerable-road-user crashes skew younger:
- Ages 21 to 24 lead motorcycle involvement.
- Ages 21 to 24 also lead pedestrian involvement.
- Ages 25 to 34 lead cyclist involvement.
Men had higher population-adjusted involvement rates across all three categories.
Reducing Left-Turn Collisions: Are Right Turns Safer?
The data provides a clear answer: yes, right turns were substantially safer than left turns in the fatal-crash data analyzed. From 2020 through 2024, the population-adjusted rate of drivers involved in fatal crashes while turning left was 6.10 per 100,000 residents age 15 and older.
For drivers turning right, the rate was just 0.42. That means the left-turn fatal-crash involvement rate was 14.37 times higher than the right-turn rate.
Perhaps even more striking, the left-turn rate exceeded the right-turn rate in every state and Washington, D.C. This was one of the most consistent findings in the entire Left Turn Fatal Crash Risk Index.
Why Are Left Turns More Dangerous?
The answer largely comes down to the path the vehicle must travel. A conventional left turn often requires a driver to cross directly through opposing traffic. That creates crossing conflict points associated with severe angle and head-on crashes.
A right turn generally does not require the same direct crossing of opposing through traffic. Instead, it primarily involves merging, diverging, and interactions with pedestrians or cyclists.
The Federal Highway Administration (FHWA) identifies crossing conflicts as particularly dangerous because they create opportunities for severe right-angle crashes.
That does not mean right turns are harmless. Drivers turning right on red, for example, may focus heavily on looking left for approaching vehicles and fail to notice a pedestrian or cyclist approaching from another direction.
Dedicated Turn Lanes Can Separate Traffic
One of the simplest engineering strategies is physically separating turning vehicles from through traffic.
The FHWA identifies dedicated left- and right-turn lanes as a proven safety countermeasure. Dedicated left–turn lanes are associated with a 28% to 48% reduction in total crashes.
Positive-offset left-turn lanes can further improve safety by giving drivers a clearer view of approaching traffic. The FHWA reports these designs are associated with a 36% reduction in fatal and injury crashes.
Better separation and better sight lines can reduce the pressure of trying to make a turn while through traffic continues moving around the driver.
Median U-Turns and RCUTs Can Eliminate Direct Crossings
Some intersection designs go further by removing the direct left turn altogether. Two examples of this are the Median U-Turn intersections and Restricted Crossing U-Turns (RCUTs), which reroute drivers so they do not have to make the same direct crossing movement through opposing traffic.
Instead, a driver may continue through an intersection or turn right, make a controlled U-turn farther down the road, and then complete the trip from a safer direction.
The safety advantage comes from dramatically reducing crossing conflict points. A conventional four-leg intersection has 16 vehicle crossing conflict points. According to the FHWA:
- A Median U-Turn design reduces crossing conflicts to four, a 75% reduction.
- An RCUT can reduce crossing conflicts by 87%.
The FHWA reports that Median U-Turn intersections can reduce severe crashes associated with crossing conflicts by nearly 70%. A Michigan evaluation also found average reductions of 31% in total crashes and 32% in injury crashes after Median U-Turn designs were implemented.
Centerline Hardening Can Slow Down Dangerous Turns
Not every road can eliminate direct left turns. In those locations, another strategy is to make the turn itself slower and more deliberate.
San Francisco has tested centerline-hardening treatments using vertical posts, rubber speed bumps, enhanced centerlines, and painted safety areas. These treatments discourage drivers from cutting diagonally across an intersection.
Instead, they force a tighter, squarer turn and give drivers more time to see pedestrians and cyclists. The city’s pilot program reduced average left-turn speeds by 17%. It also reduced the likelihood of drivers making a turn faster than 15 mph by 71%.
Importantly, those figures measure changes in dangerous turning behavior, not a 71% reduction in crashes. Following the pilot, San Francisco expanded left-turn traffic calming and completed treatments at 35 high-priority locations by January 2026.
Washington, D.C., found similar results with centerline hardening. The city used rubber curbs and flexible posts to prevent drivers from cutting diagonally through intersections. The treatment was associated with:
- A 70.5% reduction in vehicle-pedestrian conflicts.
- A 9.8% reduction in average left-turn speeds.
- A 67.1% reduction in the odds of turning faster than 15 mph.
Again, the 70.5% figure refers to conflicts, not actual crash reductions. A reduction in conflicts is an encouraging safety outcome, but it should not be presented as a direct reduction in crashes unless crash data specifically supports that conclusion.
“Many left-turn crashes are potentially preventable through safer roadway design and more cautious driving,” said a representative from Sweet James. “Protected turn phases, dedicated lanes, better sight lines, slower and squarer turns, and designs that eliminate direct crossings can all reduce the conflicts that make left turns so dangerous.”
The Safest Designs Reduce Decisions and Conflicts
The common theme across the most promising safety measures is simple: reduce the number of difficult decisions a driver has to make during the turn.
- Dedicated turn lanes separate turning traffic from through traffic.
- Positive-offset lanes improve visibility.
- Centerline hardening slows the vehicle and forces a squarer turn.
- Median U-Turn and RCUT designs eliminate or reroute the direct crossing movement entirely.
The more an intersection can separate, slow, or eliminate dangerous crossing conflicts, the fewer opportunities there are for a driver to make a fatal mistake.
Left Turns Require More Than Routine Attention
Connor Lopez’s death began with a moment familiar to millions of drivers: someone attempting to make a left turn.
The road where the crash occurred met applicable design standards. That fact does not make the loss less tragic, nor does it mean the crash was unavoidable. Instead, it highlights the difficult reality of left-turn safety: even on roads that function as intended, drivers can still face complex decisions involving traffic gaps, speed, visibility, and vulnerable road users — and a single misjudgment can cost lives.
The data behind the Left Turn Fatal Crash Risk Index shows just how significant that risk can be.
Across the United States, left–turning drivers were involved in fatal crashes at a rate more than 14 times higher than right-turning drivers.
The highest-risk states were not defined by one problem alone. Many showed elevated rates across motorcycle involvement, distraction, impairment, hit-and-run crashes, and other factors.
No single solution will eliminate every left-turn collision; there are just too many factors, similar to other types of crashes. Drivers can reduce risk by slowing down, waiting for clear gaps, carefully checking their blind spots, watching for pedestrians and motorcycles, and avoiding the assumption that an approaching vehicle is farther away or moving more slowly than it actually is.
Communities and transportation agencies can also make a difference by improving sight lines, adding dedicated turn lanes, slowing turning movements, installing protected phases, and redesigning intersections to eliminate unnecessary crossing conflicts.
At Sweet James, our mission is to defend the powerless and level the playing field for real people who have been hurt through no fault of their own.
We know that serious crashes can change a family forever. If you’ve been injured in a left-turn accident, reach out to a car accident lawyer from our firm for a free consultation to explore your legal options.
Call or text (800) 900-0000 or complete a Free Case Evaluation form