Roughly one in five California drivers is estimated to be uninsured, a rate about one-third higher than the national level. To understand the scale and cost of California’s uninsured driver problem, we at Sweet James analyzed published uninsured-motorist estimates for all 50 states and Washington, D.C., then examined what a coverage gap costs drivers on both sides of a crash.
Our analysis draws on 2023 Insurance Research Council (IRC) estimates, which are calculated from insurance claims. This data shows how common uninsured driving was that year; it does not count uninsured cars on the road. In fact, no such verified daily count exists.
Alongside those estimates, we reviewed California statutes and official fee schedules to answer three questions: how California compares with the rest of the country, what protection a victim has when the other driver cannot pay, and what costs build up for a driver without coverage.
California’s Coverage Gap in National Context
California’s estimated uninsured rate of 20.4% compares with a 2023 national figure of 15.4%. Subtracting one from the other gives a gap of 5.0 percentage points. Measured against the national rate, that gap makes California’s rate 32.5% higher.
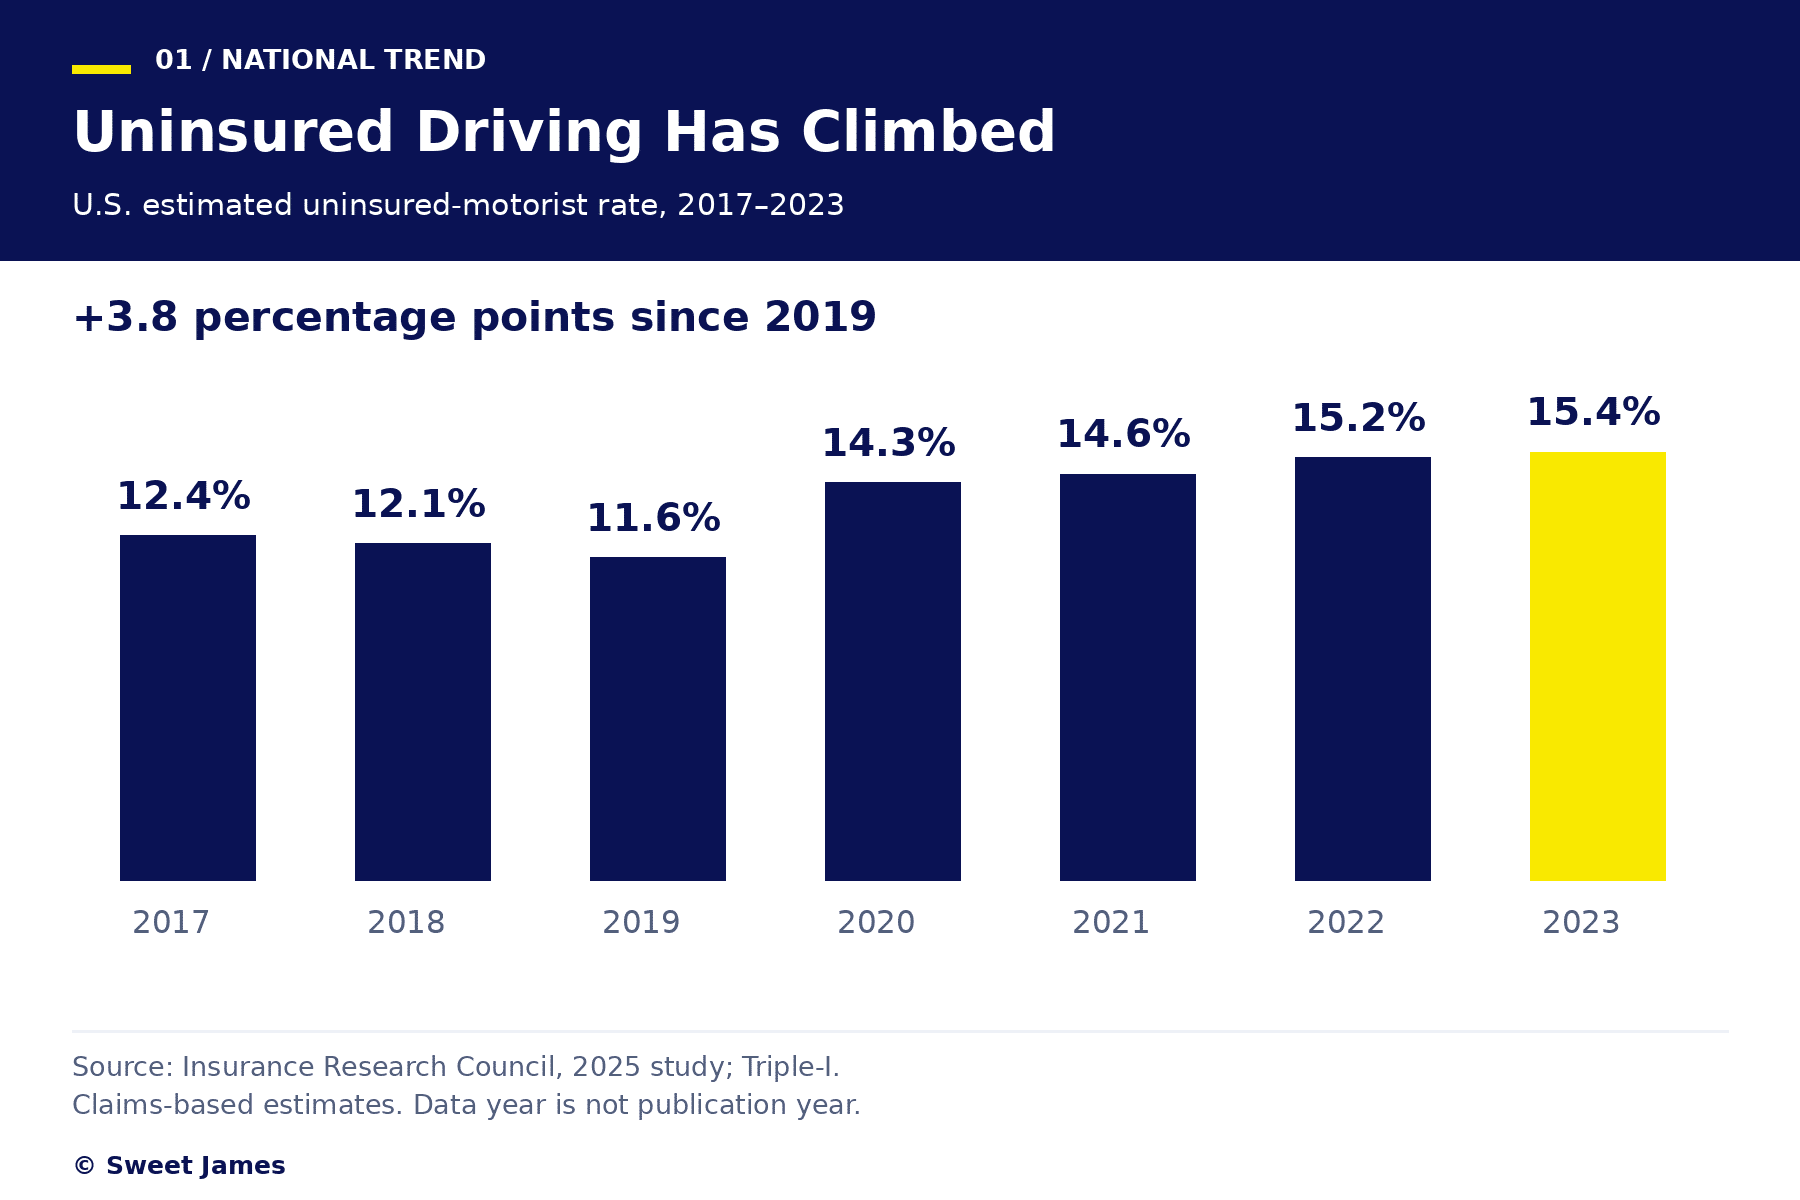
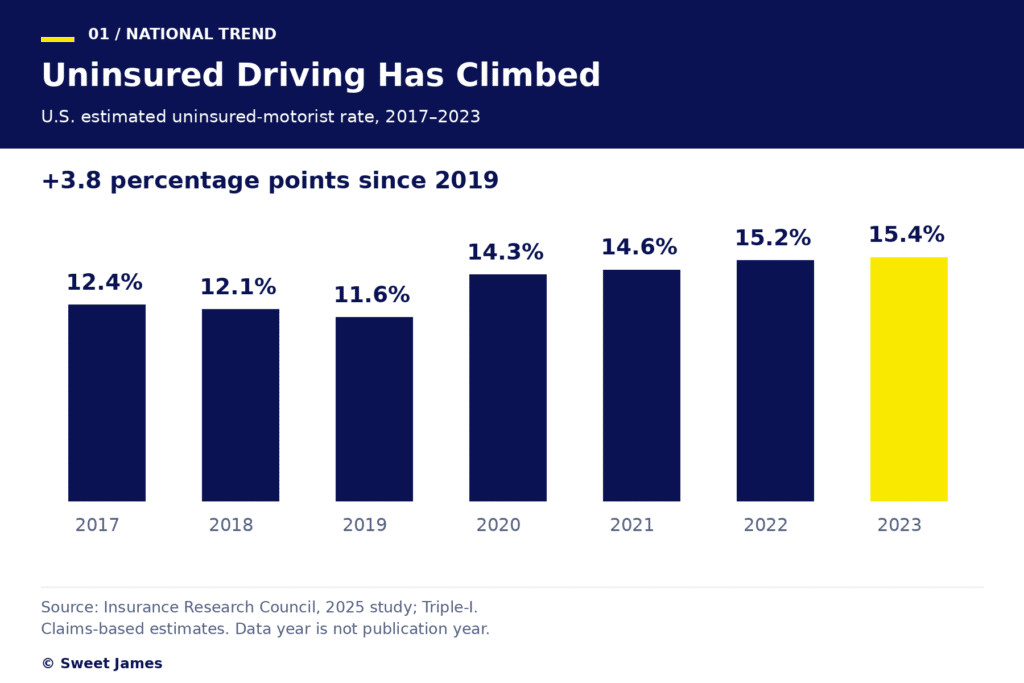
The national figure has itself shifted considerably in recent years, rising sharply before reaching a plateau. The estimate increased from 11.6% in 2019 to 15.4% in 2023, a rise of 3.8 percentage points, or 32.8%. Of that net increase, 71.1% occurred between 2019 and 2020. While the data establishes when the increase took place, it does not identify a cause. Since then, the rate has stabilized, changing only marginally from 15.2% in 2022 to 15.4% in 2023.
All of these figures refer to drivers with no insurance at all. The IRC also publishes a broader measure that adds underinsured drivers, whose policies may not cover the full cost of the damage they cause. By that measure, 33.4% of U.S. drivers were either uninsured or underinsured in 2023.
Returning to the uninsured-only estimates, California ranks 8th of 51 jurisdictions, including D.C., and 7th among the states alone. Its estimated coverage gap is above the national level, and a state-by-state comparison shows how wide the differences between states can be.
Call or text (800) 900-0000 or complete a Free Case Evaluation form
Where Uninsured-Motorist Rates Are Highest
The comparison places Mississippi at the top, with an estimated uninsured rate of 28.2%. California, at 20.4%, falls within the highest-rate group.
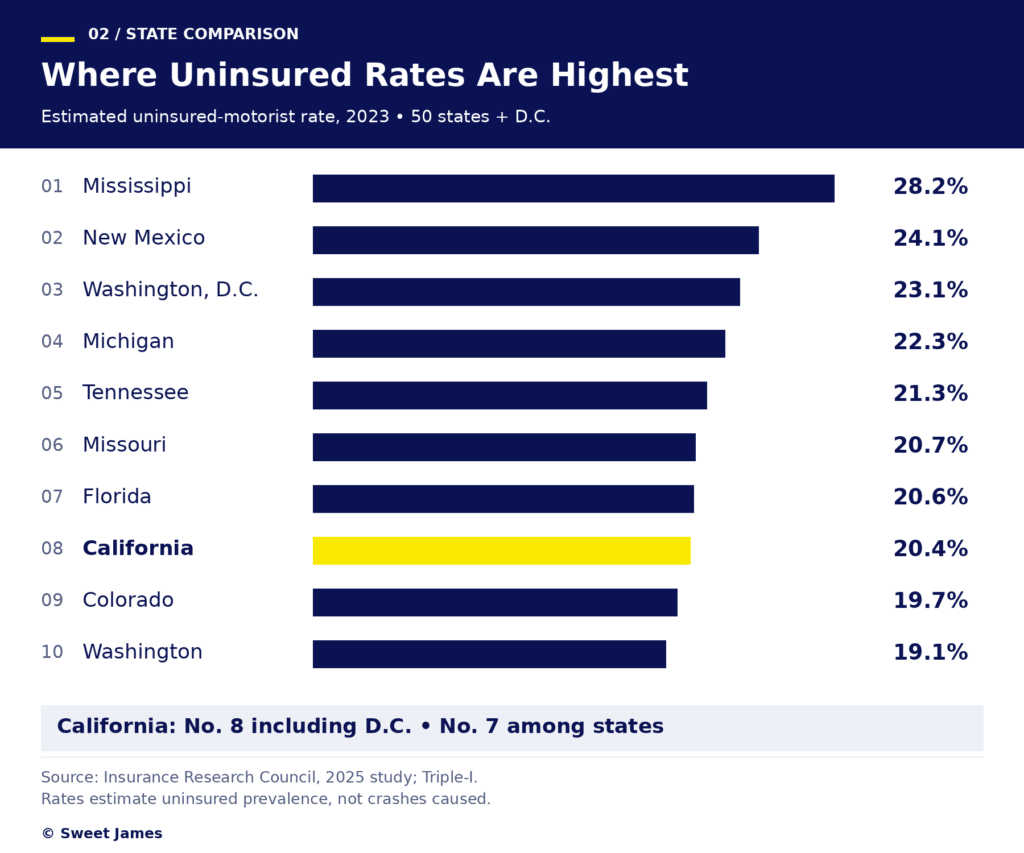
At the other end of the scale, Maine has the lowest estimate at 5.7%. Mississippi’s rate is 4.95 times Maine’s, a spread of 22.5 percentage points, while California’s rate is 3.58 times Maine’s.
Between those two extremes, 15 states and D.C. sit above the national rate of 15.4%, and the remaining 35 states fall below it. When D.C. is left out, and only states are ranked, Georgia (19.0%) moves into the top 10.
California’s position stands out further against its neighbors and other large states. Its rate is 5.7 percentage points above Oregon’s, 9.3 above Nevada’s, and 9.8 above Arizona’s. It also sits 5.9 points above Texas’s and 11.8 points above New York’s, while trailing Florida by just 0.2 points.
These rankings measure how common uninsured driving is in each state. They do not show where uninsured drivers cause more crashes, and verified uninsured estimates are not available for individual cities.
The rankings indicate the scale of the coverage gap, but its financial cost is borne by the person left with an injury or a damaged vehicle.
Call or text (800) 900-0000 or complete a Free Case Evaluation form
What Happens When the Other Driver Can’t Pay?
For that person, the burden begins with the crash itself. Our analysis of the National Safety Council (NSC) 2024 estimates shows that the average economic cost of an injury rises sharply with its severity, with a disabling injury costing 3.87 times as much as an evident one.
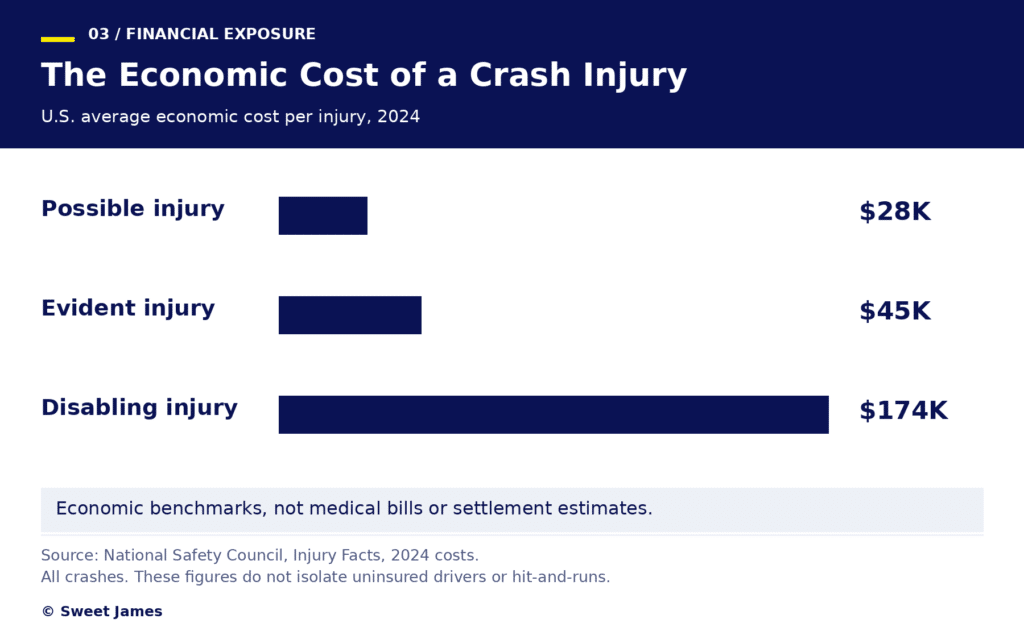
These figures are national benchmarks of economic cost. They are not medical bills or settlement values, and they do not reflect losses specific to crashes involving uninsured drivers. What an individual victim ends up paying depends on the type of loss and the terms of their own policy.
That policy becomes central when the at-fault driver has no insurance. In California, uninsured motorist bodily injury (UMBI) coverage applies to covered injuries caused by an at-fault uninsured driver. Vehicle damage falls under uninsured motorist property damage (UMPD) coverage, which is capped at $3,500 and applies only when the uninsured driver is identified. Collision coverage offers a separate route for vehicle damage, subject to a deductible and the policy’s conditions.
Not every policy includes these protections. California insurers must offer uninsured and underinsured motorist coverage, but a policyholder can decline it by signing a waiver, so being offered the coverage does not mean a policy carries it.
Even where UMPD applies, its limit can leave a shortfall. In an assumed example with $10,000 of eligible vehicle damage, where coverage applies, and the uninsured driver has been identified, $6,500 of that damage would fall above the $3,500 limit.
Hit-and-run crashes raise a separate issue. A driver who flees the scene may still be insured, so hit-and-run figures cannot be read as a measure of uninsured driving, and the data does not establish how many hit-and-run crashes involve an uninsured driver.
The scale of hit-and-run crashes is still considerable. Our review of AAA Foundation research found that an estimated 919,292 hit-and-run crashes in the U.S. in 2023 caused an estimated 242,886 injuries and 2,872 deaths, 3.4% fewer deaths than 2022’s figure of 2,972. In California, 10.5% of the 28,494 traffic deaths between 2017 and 2023 occurred in hit-and-run crashes, a share that rises to 26.4% among pedestrians and cyclists.
The consequences do not fall on victims alone. The uninsured driver faces penalties of their own, along with possible limits on compensation, even when another driver caused the crash.
Call or text (800) 900-0000 or complete a Free Case Evaluation form
A Coverage Lapse Affects Both Penalties and Recovery
Those penalties begin with a fine set by statute, but a base fine is only one consequence of driving uninsured in California. State law also restricts what an uninsured person can recover after a crash, and it treats a crash-related license suspension separately from action on a vehicle’s registration. Because these consequences arise under different laws, the table below sets them out individually.
| Area | What California requires or allows |
|---|---|
| Fines (Vehicle Code §16029) | First conviction: $100 to $200 base fine. Repeat conviction within three years: $200 to $500 base fine. Assessments are added to both. San Diego’s 2026 court schedule lists a base bail of $200 and $500 for the corresponding offenses. |
| Minimum coverage | $30,000 per person, $60,000 per accident, $15,000 property damage |
| Alternatives to a policy | $75,000 cash deposit or surety bond, or a DMV self-insurance certificate |
| Recovery after a crash (Civil Code §3333.4) | Specified uninsured owners and drivers are generally barred from non-economic damages |
| License (Vehicle Code §16070) | Suspension of at least one year after a reportable crash without proof of insurance |
| Registration | DMV can suspend separately for lack of proof of insurance |
Beyond the fine, Civil Code §3333.4 affects what an uninsured person can recover after a crash. Passed through Proposition 213 in 1996, it generally bars specified uninsured owners and drivers from recovering non-economic damages, meaning compensation for harm that does not come with a bill, such as pain and suffering.
The restriction can apply even when the uninsured person did not cause the crash. It does not, however, automatically bar claims for economic losses, such as medical bills or lost wages. The law also includes a narrow exception: an uninsured vehicle owner, in a category the statute defines, may be exempt if injured by a driver convicted of driving under the influence.
License consequences follow a separate process. After a crash involving injury or death, or more than $1,000 of property damage to either party, drivers must file an SR-1 report with the DMV within 10 days. A driver who cannot show proof of insurance faces a license suspension of at least one year and must then maintain proof of financial responsibility, such as an SR-22, for three years. That suspension does not depend on who caused the crash, and the DMV can also suspend a vehicle’s registration separately when there is no proof of insurance on file.
These consequences may take months or years to play out, but not every cost of a lapse arrives so slowly. A tow brings an immediate expense, and one that increases with every day a vehicle stays in the lot.
Call or text (800) 900-0000 or complete a Free Case Evaluation form
The Bill for Getting a Car Back
San Francisco’s official fee schedule shows how quickly that expense can build. Our analysis of current San Francisco Municipal Transportation Agency (SFMTA) fees found that recovering a towed car after seven days in impound costs $1,213. That figure assumes a first-time, standard tow with no fee relief. SFMTA lists reduced fees for eligible low-income owners, who pay a $0 administrative fee and a $111 tow fee, and offers broader one-time waivers for eligible people experiencing homelessness.
Without relief, the seven-day bill breaks down as shown below.
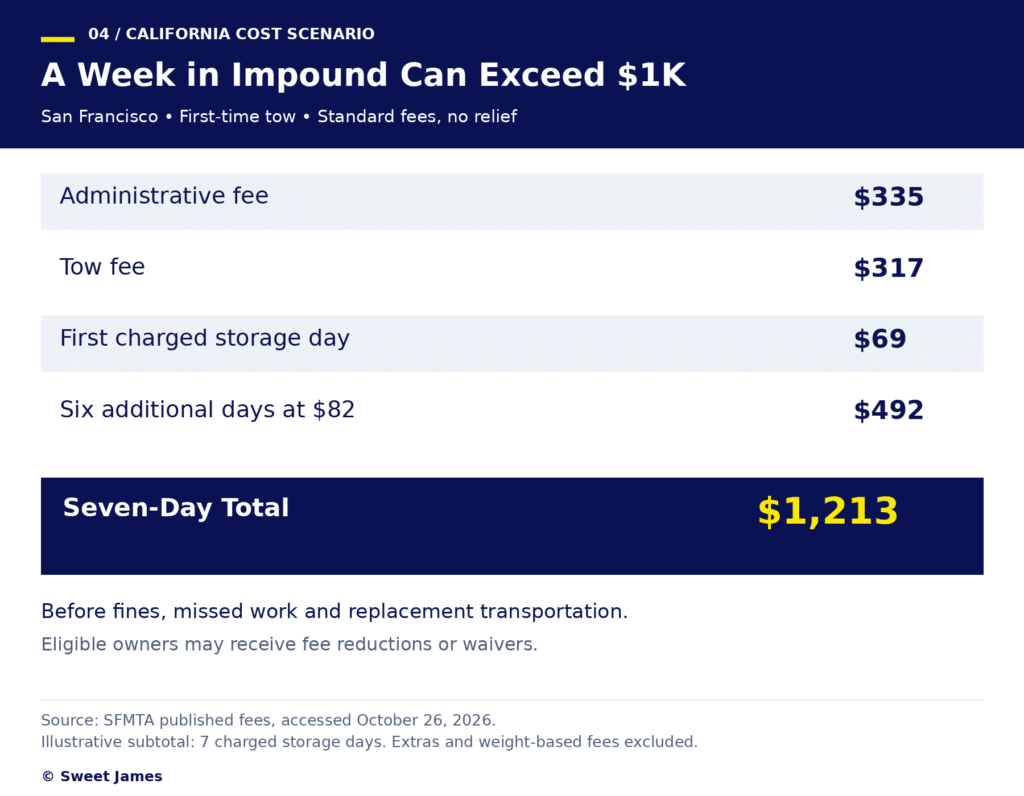
Storage is where the bill grows. The first four hours are free, so the same car collected after one storage day would cost $721. Leaving it for seven days adds $492, an increase of 68.2%, and the total continues to rise with each additional day.
| Days in storage | Total bill (San Francisco scenario) |
|---|---|
| 1 | $721 |
| 3 | $885 |
| 7 | $1,213 |
| 14 | $1,787 |
| 30 | $3,099 |
At that rate, a second week adds $574 in storage alone. Repeat tows also cost more, with the administrative fee rising to $385, which is $50 more than for a first tow.
Fees elsewhere in California are structured differently. Under Los Angeles’s official rates, effective January 1, 2026, a tow plus seven storage days comes to a subtotal of $696 paid by credit card, or $677 by other methods. This is a partial figure, as it excludes city release fees, parking taxes, surcharges, and extra tow time, which costs $109 per half-hour by credit card ($106 otherwise) after the first hour. Because the two cities build their bills differently, the San Francisco and Los Angeles figures cannot be compared like-for-like.
In either city, the lot invoice leaves out the cost of being without a vehicle. In an illustrative scenario, adding one missed workday and nine trips to the seven-day San Francisco bill brings the total to $1,684.40. The missed workday is valued at $246.40, based on the Q3 2026 national median weekly wage of $1,232 divided across an assumed five-day work week. The trips cost an assumed $25 each, adding $225. The single missed day and the trip cost are analyst assumptions, and the $25 figure is not a measured local fare.
Because release requirements vary by city and agency, confirming what is needed before heading to the lot is a practical first step for any owner.
What a Coverage Gap Costs California Drivers
With roughly one in five drivers estimated to be uninsured, California’s rate sits well above the national level, and a single crash can create costs for drivers on both sides. Victims can find that their own policy falls short, particularly for vehicle damage above the $3,500 UMPD limit. Uninsured drivers can face penalties and restricted compensation that extend well beyond the original fine.
Many of those costs arrive before any claim is settled, and a towed vehicle adds to them for each day it remains in the lot. Knowing what a policy covers, including whether it carries uninsured motorist coverage, gives drivers a clearer picture of their exposure. More information on how these claims work is available from our California car accident lawyers.
Sources
- Insurance Information Institute: Facts + Statistics, Uninsured Motorists
- Insurance Research Council: One in Three Drivers Are Either Uninsured or Underinsured
- AAA Foundation for Traffic Safety: Understanding the Increase in Fatal Hit-and-Run Crashes
- National Safety Council Injury Facts: Guide to Calculating Costs
- California Department of Insurance: Automobile Insurance
- California Vehicle Code §16029
- Superior Court of California, County of San Diego: 2026 Bail Schedule
- California DMV: Insurance Requirements
- California Secretary of State: Proposition 213 Text
- California Civil Code §3333.4
- California DMV: Financial Responsibility (Insurance)
- SFMTA: Towed Vehicles
- SFMTA: Reduced Fees for First-Time Tow and Low-Income Individuals
- Los Angeles City Clerk: Official Police Garage Rates, Effective January 1, 2026
- Bureau of Labor Statistics: Usual Weekly Earnings, Third Quarter 2026
Call or text (800) 900-0000 or complete a Free Case Evaluation form